By Iqra Sharjeel
When we look up at the sky, we see what seems like an endless expanse of blue. Yet beyond that deceptively simple sight lies an intricately structured, life-sustaining blanket of gases known as the atmosphere. Earth’s atmosphere is a complex and dynamic system divided into distinct layers, each playing a crucial role in supporting life, regulating temperature, shielding us from radiation, and even defining the boundary between Earth and space. The graph shared above provides a detailed cross-sectional view of these atmospheric layers, charting how temperature and pressure vary with altitude, and highlighting key phenomena and human activity that occur within each region.
Breaking Down the Graph: A Quick Overview
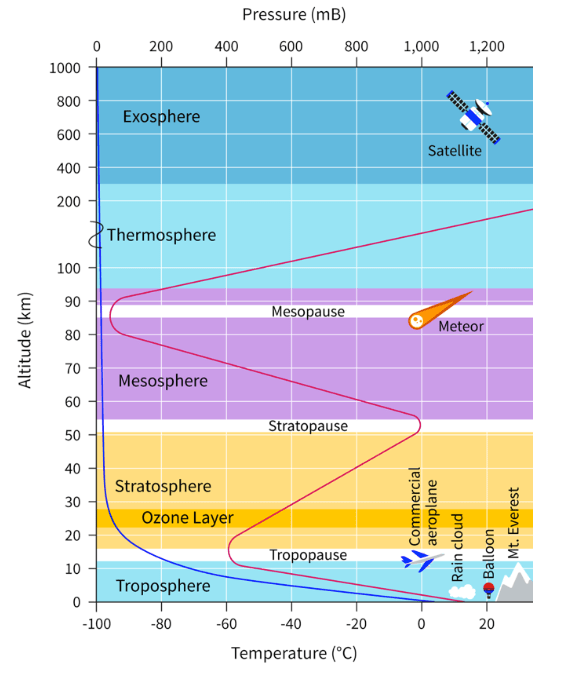
The vertical axis of the graph represents altitude in kilometers, ranging from Earth’s surface up to 1,000 km. On the horizontal axis, we see temperature (in degrees Celsius) and air pressure (in millibars, mB). The layered colors define the five main layers of the atmosphere: the troposphere, stratosphere, mesosphere, thermosphere, and exosphere. In addition, the graph plots a red curve showing how temperature changes with height and a scale indicating air pressure, which dramatically decreases as we ascend. The chart also marks key phenomena like commercial airplane altitudes, balloons, meteors, and satellites, offering real-world context.
1. Troposphere: The Cradle of Life and Weather
Starting from the Earth’s surface and extending up to about 12–15 km, the troposphere is the lowest and most crucial layer of the atmosphere. It contains around 75% of the atmosphere’s mass and nearly all of its water vapor, making it the layer where weather occurs — from gentle breezes to devastating hurricanes. The graph clearly shows that temperature decreases with altitude in this layer, dropping from an average of 15°C at sea level to around -55°C at the tropopause (its upper boundary). This decline in temperature occurs because the troposphere is heated from below; solar radiation warms the Earth’s surface, which in turn warms the air above it.
Within this zone, we find rain clouds, weather balloons, and Mount Everest — the highest point on Earth, standing at about 8.8 km. Commercial aircraft also operate near the upper troposphere, where turbulence tends to be lower. However, this layer is also vulnerable to pollution, especially from ground-level emissions, contributing to air quality issues and climate change.
2. Stratosphere: Home of the Ozone Layer
Above the troposphere lies the stratosphere, which stretches from approximately 15 km to 50 km in altitude. Unlike the troposphere, temperature in the stratosphere increases with height, a phenomenon called a temperature inversion. This warming is due to the ozone layer, which absorbs harmful ultraviolet (UV) radiation from the sun and converts it into heat. The ozone layer is vital for shielding life on Earth from DNA-damaging UV rays.
This layer is also the preferred domain of commercial jet aircraft flying at high altitudes (about 10–12 km), where they encounter less drag and turbulence. The calm, stable air in the stratosphere supports long-distance flights and scientific research using high-altitude balloons. The boundary between the stratosphere and mesosphere is known as the stratopause, and the temperature here reaches approximately 0°C, as shown in the graph.
3. Mesosphere: Where Meteors Burn
The mesosphere, ranging from 50 km to 85–90 km, is perhaps the least understood layer due to its inaccessibility — too high for aircraft and balloons, but too low for satellites. The graph shows that temperature once again decreases with altitude in this layer, dropping to around -90°C at the mesopause, the coldest part of the atmosphere. One of the most spectacular events that occur here is the burning of meteors, which appear as “shooting stars” as they collide with atmospheric particles and ignite due to friction.
This region plays a vital role in protecting Earth from extraterrestrial debris, but it is also a frontier for scientific exploration. Scientists study the mesosphere to understand atmospheric tides, gravity waves, and noctilucent clouds — mysterious ice-crystal clouds that glow after sunset.
4. Thermosphere: Gateway to Space
Extending from about 90 km to 500–600 km, the thermosphere is where temperature trends reverse again, showing a sharp increase with altitude. According to the graph, temperatures can rise to 1,500°C or more, but interestingly, it wouldn’t feel hot to humans because the density of air is extremely low, meaning very few particles are present to transfer heat.
The thermosphere is home to the auroras — the northern and southern lights — caused by charged solar particles interacting with Earth’s magnetic field. This layer also houses the International Space Station (ISS) and other low-Earth orbit satellites, making it essential for space research, GPS navigation, and telecommunications. The thermosphere’s high temperatures are due to the absorption of intense solar radiation, including X-rays and extreme UV rays.
5. Exosphere: The Edge of Earth’s Atmosphere
At the very top lies the exosphere, which begins around 600 km and extends to 1,000 km or more, gradually fading into outer space. The air pressure is nearly zero, and gas molecules are so sparse that they can travel hundreds of kilometers without colliding. The exosphere is technically still part of Earth’s atmosphere, but it’s almost a vacuum — a transitional zone between our planet and the infinite cosmos.
This layer is where satellites orbit the Earth, beyond the influence of weather and atmospheric drag. The exosphere is critical for satellite stability and orbital velocity, but it is also exposed to harmful solar winds and radiation. Understanding this outermost layer helps us safeguard the future of space exploration and satellite technology.
Air Pressure: A Rapid Decline with Altitude
The graph also shows how air pressure decreases exponentially with altitude. At sea level, pressure is about 1,013 millibars, but this drops to near zero in the exosphere. This rapid decline explains why breathing becomes difficult at high altitudes and why pressurized cabins are necessary for commercial aircraft. Pressure also plays a significant role in climate systems, wind circulation, and the behavior of gases, influencing everything from cooking at high altitudes to the design of spacecraft.
Temperature Fluctuations: Why They Matter
One of the most fascinating features of the graph is how temperature fluctuates non-linearly with altitude. Instead of consistently decreasing or increasing, temperature alternates — falling in the troposphere, rising in the stratosphere, falling in the mesosphere, and rising again in the thermosphere. These variations are due to energy absorption patternsat different heights, especially related to ozone absorption, solar radiation, and molecular density.
Understanding these patterns is crucial for climate modeling, aviation safety, and even predicting the effects of solar storms on Earth’s magnetic field. It also helps scientists design technology that can withstand extreme temperatures, such as satellites and space probes.
Real-World Applications and Implications
The data shown in this atmospheric graph has wide-ranging implications for environmental science, aviation, astronomy, and climate change policy. For instance:
- Weather forecasting relies heavily on understanding tropospheric conditions.
- Ozone monitoring is essential for controlling harmful UV exposure.
- Satellite deployment must account for thermospheric drag and radiation risks.
- Space missions are planned with the thermosphere and exosphere in mind.
- Pollution control depends on how gases disperse in different layers.
The graph also reminds us of our vulnerability to atmospheric changes. Climate change is not confined to surface temperatures; it influences the entire atmospheric system. For example, warming in the troposphere may correspond with cooling in the stratosphere, altering weather patterns and weakening the jet stream. Similarly, ozone depletion or changes in solar radiation could disrupt the delicate balance in the stratosphere and thermosphere.
Conclusion: A Fragile Shield Worth Protecting
The atmosphere is more than just “air”; it is a layered, living system that sustains life, enables exploration, and connects the Earth to the broader universe. This graph provides a powerful visual summary of the structure and complexity of the atmosphere, illustrating how temperature and pressure vary, how different layers serve distinct functions, and how human activity intersects with natural systems.
As we continue to face global challenges like climate change, air pollution, and space debris, our understanding of the atmosphere becomes even more vital. Each layer plays a unique role in Earth’s health, and through careful observation, international cooperation, and responsible innovation, we can ensure that this invisible yet essential shield remains intact for generations to come.


You must be logged in to post a comment.